> ## Documentation Index
> Fetch the complete documentation index at: https://docs.sixtyfour.ai/llms.txt
> Use this file to discover all available pages before exploring further.
# Usage & API Logs
> Monitor credit balances, track API usage over time, inspect individual request logs, and export history as CSV.
The Sixtyfour dashboard provides a usage dashboard and detailed API call logs so you can track spend, monitor request volume, and debug individual API calls.
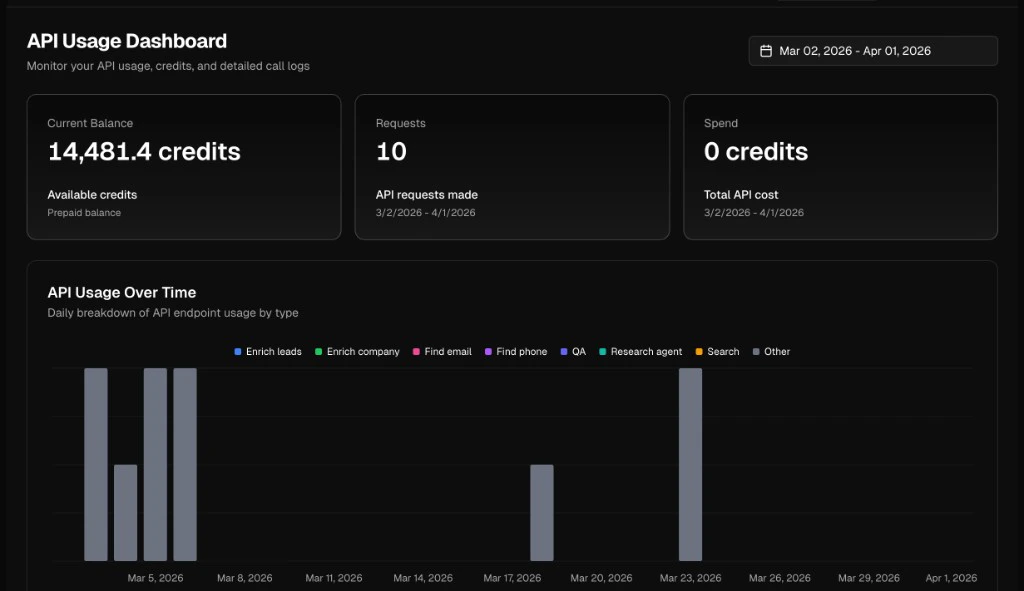
## Usage Dashboard
The dashboard displays three summary metrics and a time-series chart.
| Metric | Description |
| ------------------- | -------------------------------------------------- |
| **Current Balance** | Remaining prepaid credits on your account |
| **Requests** | Total API requests made in the selected date range |
| **Spend** | Total credit cost for the selected date range |
The **API Usage Over Time** chart breaks down daily request volume by endpoint type — People Intelligence, Company Intelligence, Find email, Find phone, QA, Research agent, Search, and others.
Use the date picker in the top right to adjust the time range.
 * Programmatically check your balance with the [`/check-balance`](/api-reference/account/check-balance) endpoint.
* AI assistants can call the same data via the `sixtyfour_check_balance` tool on the [Intelligence MCP server](/developer-tools/mcp-setup).
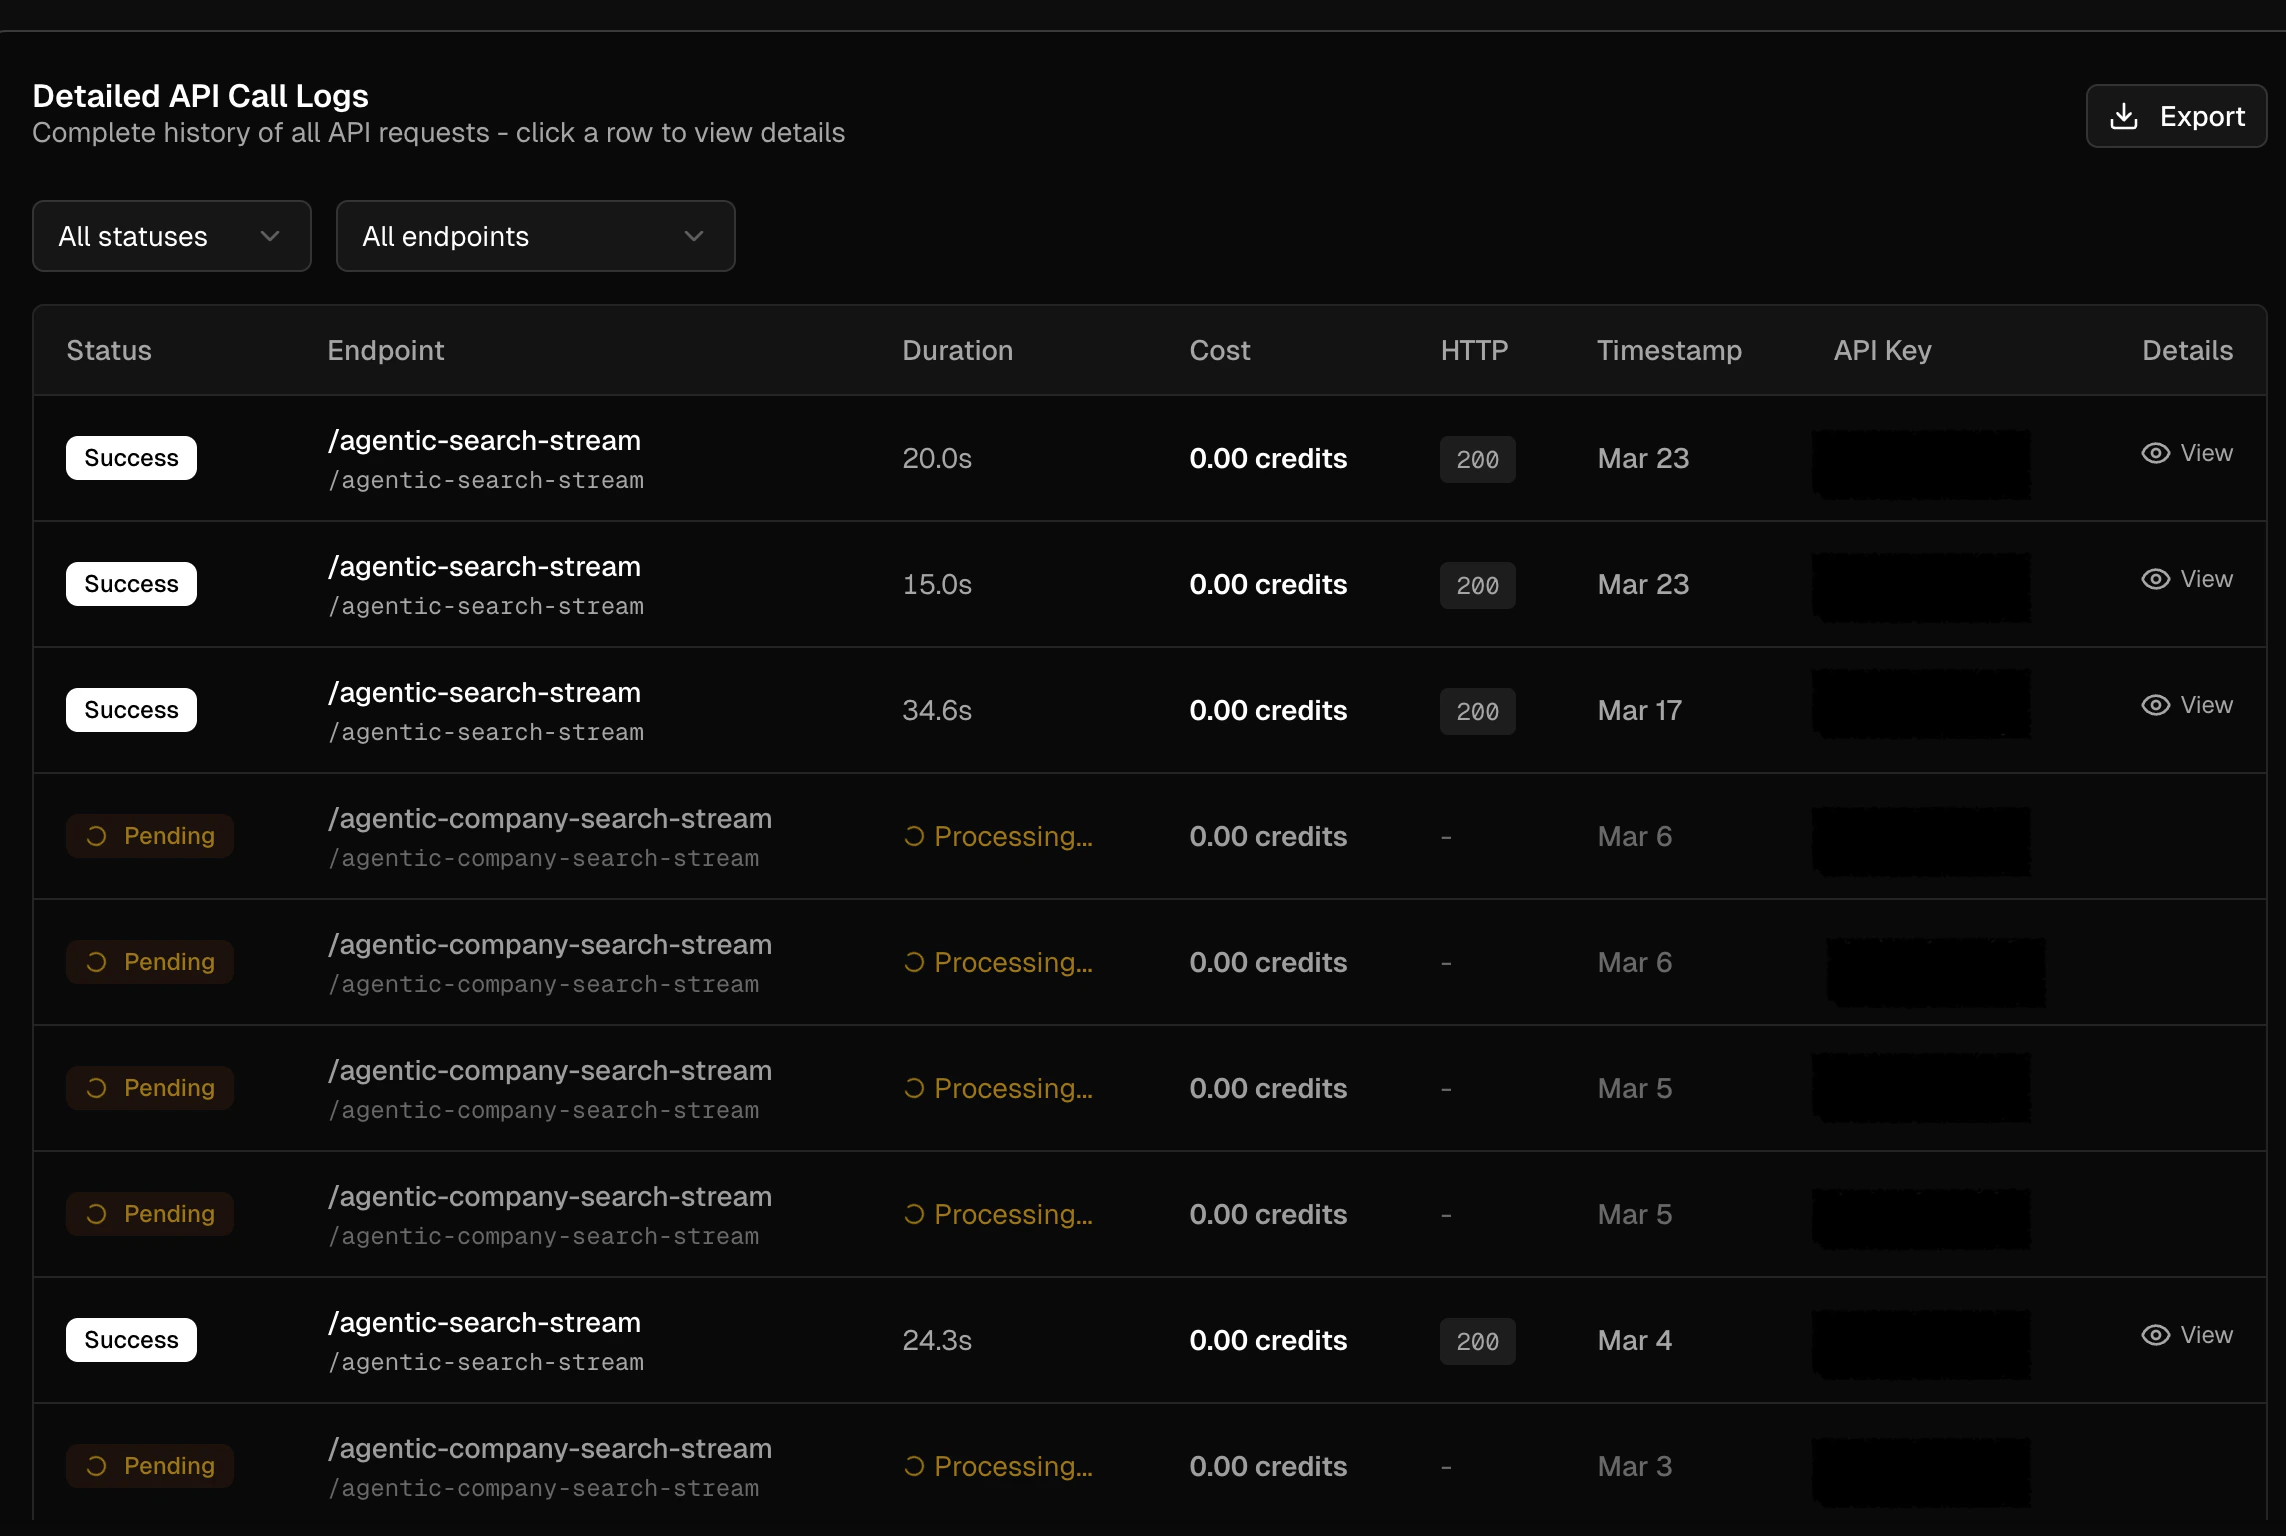
## API Call Logs
The **Detailed API Call Logs** table shows a complete history of every API request. Each row includes:
| Column | Description |
| ------------- | -------------------------------------------------- |
| **Status** | Request outcome — `Success`, `Pending`, or `Error` |
| **Endpoint** | The API endpoint called |
| **Duration** | Total processing time |
| **Cost** | Credits consumed by the request |
| **HTTP** | HTTP status code returned |
| **Timestamp** | Date the request was made |
| **API Key** | Truncated key used for the request |
| **Details** | Link to view the full request and response |
### Filtering Logs
Use the dropdown filters above the table to narrow results:
* **Status** — filter by `Success`, `Pending`, or `Error`
* **Endpoint** — filter by specific API endpoint
* Programmatically check your balance with the [`/check-balance`](/api-reference/account/check-balance) endpoint.
* AI assistants can call the same data via the `sixtyfour_check_balance` tool on the [Intelligence MCP server](/developer-tools/mcp-setup).
## API Call Logs
The **Detailed API Call Logs** table shows a complete history of every API request. Each row includes:
| Column | Description |
| ------------- | -------------------------------------------------- |
| **Status** | Request outcome — `Success`, `Pending`, or `Error` |
| **Endpoint** | The API endpoint called |
| **Duration** | Total processing time |
| **Cost** | Credits consumed by the request |
| **HTTP** | HTTP status code returned |
| **Timestamp** | Date the request was made |
| **API Key** | Truncated key used for the request |
| **Details** | Link to view the full request and response |
### Filtering Logs
Use the dropdown filters above the table to narrow results:
* **Status** — filter by `Success`, `Pending`, or `Error`
* **Endpoint** — filter by specific API endpoint
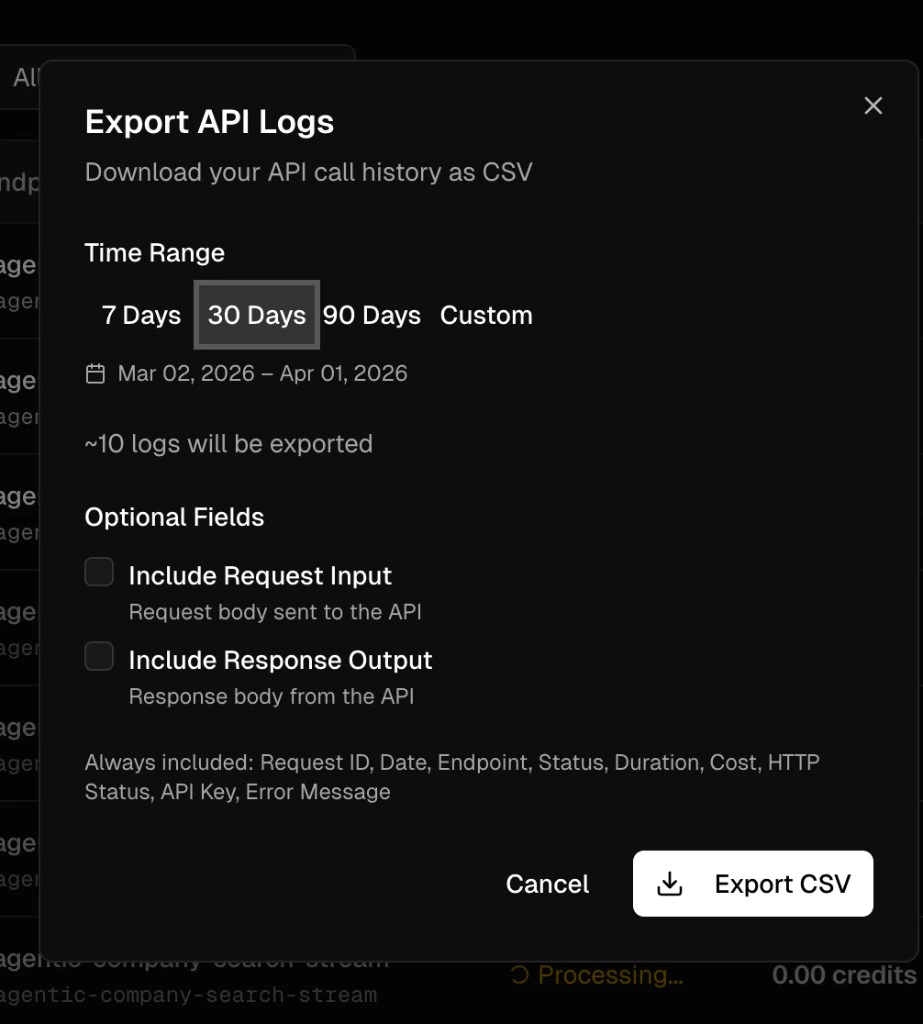
 ## Exporting Logs
You can export up to 10k rows of API logs as a CSV.
Click the **Export** button above the logs table to download your API call history as a CSV file.
The export dialog provides the following options:
### Time Range
Select a preset range — **7 Days**, **30 Days**, **90 Days** — or choose **Custom** to define a specific date window.
### Optional Fields
By default, exports include: Request ID, Date, Endpoint, Status, Duration, Cost, HTTP Status, API Key, and Error Message.
You can add two optional fields:
* **Include Request Input** — the request body sent to the API
* **Include Response Output** — the response body returned from the API
Click **Export CSV** to download.
## Exporting Logs
You can export up to 10k rows of API logs as a CSV.
Click the **Export** button above the logs table to download your API call history as a CSV file.
The export dialog provides the following options:
### Time Range
Select a preset range — **7 Days**, **30 Days**, **90 Days** — or choose **Custom** to define a specific date window.
### Optional Fields
By default, exports include: Request ID, Date, Endpoint, Status, Duration, Cost, HTTP Status, API Key, and Error Message.
You can add two optional fields:
* **Include Request Input** — the request body sent to the API
* **Include Response Output** — the response body returned from the API
Click **Export CSV** to download.